Introduction and Background
Previously we had talked much about installing and setting up the environment for R language. In this post, I will walk you through different stuff that Visual Studio provides you with. Typically, every R IDE supports the following tools and features for data processing.
- A scripting toolkit; where you can write R language code.
- An R interactive shell for executing the commands.
- Plot builder for plotting the graphics.
- Markdown editors and much more.
I will walk you through these windows in Visual Studio IDE itself and would give examples of using Visual Studio as your default IDE for R programming. In my personal (and humble) opinion, I think Visual Studio is the best IDE out there, provided its simplicity, ease of use and now that the price has also dropped down to zero for personal use! What more can someone ask for? 🙂
Exploring Visual Studio for R
I have talked about the things that we are going to explore in this post. Those are listed above, and in this section I am going to expand them and I am going to demonstrate what benefit they have for R developers in the industry of data science.
![]()
Figure 1: Visual Studio logo.
Besides R, Visual Studio is also going to have the tools for Java programming. At least, I am very much excited about Visual Studio’s future, in which it is going to be used as a universal IDE. But in this post we should just focus on the R tools provided. If you have not yet set up the R tools for Visual Studio, I recommend that you read the post of mine for that, Installing and setting up R environment on Windows. This would help you to set up the environment for data analysis using R language.
1. R code editor
First thing to know about in any IDE for any programming language, is the code editor that it has. Code editors are simply the text editors, but there are a few other additional features that it has apart from the ordinary text editing and caching services. Visual Studio code editor provides the following powerful features:
- R syntax highlighting.
- Every IDE should support syntax highlighting and highlight the different data types, different keywords and the scope resolutions like matching brackets.
- Autocomplete suggestions.
- Visual Studio calls them IntelliSense, which provides the easy way of writing the programs. It provides the clean way of providing suggestions for function calls and the parameter lists.
- Squiggly lines for errors
- It is better to show off the errors in the language syntax or commands, before programmers build their project and finally stumble upon the errors. Visual Studio shows the errors if there are any, in the commands using the interpreters!

Figure 1: Visual Studio code editor.
This is the most basic usage of the code editor at now. Visual Studio renders the codes in their own format, R syntax has been implemented in Visual Studio to support for string literals, keywords, comments and matching brackets.
You should consider using the R code editor instead of using a plain-text file to write the R scripts.
2. R interactive shell
Every interpreted programming language has an interactive shell. Python has it, so does R because R is an interpreted language. Interactive shells allow you to execute minimal programs, commands, and test the environment itself. They are also used to compile (interpret!) and execute the statements in the source file that you may have somewhere.
Visual Studio supports the Interactive Shell. If you do not find it, it is right there under R Tools → Windows → R Interactive. The WIndow allows you to enter the commands to:
- Create new variables in the environment.
- Explore the environment.
- Print the variables.
- Perform calculations on the data.

Figure 2: R interactive shell.
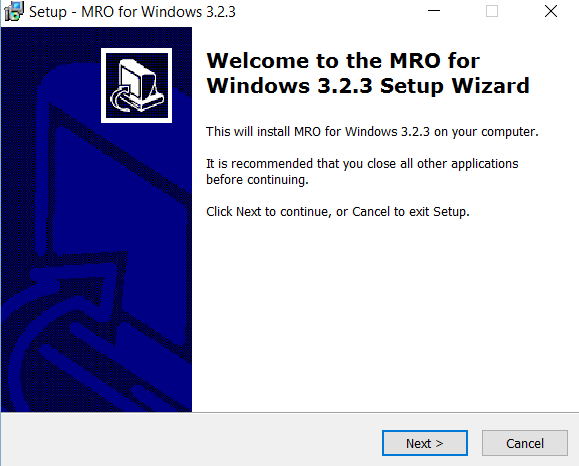
You can see that the R project starts, and then it allows the users to enter the commands that are to be tested or executed in the R environment. If you pay a bit more attention, you will see that i am currently running Microsoft’s R Open,

Figure 3: Microsoft R Open being used in the shell.
This allows you to add the commands which require execution. You can perform many functions in this shell as already mentioned above.

Figure 4: Executing commands in R Interactive Shell.
You can also run other versions of the R. But, Microsoft R Open is the Microsoft’s implementation and distribution of R language. To change the currently active engine to be used for R, you need to have other versions of R installed on your machine. If they are available, then you can update the current active R engine from the settings themselves. Just select R Tools → Options. Inside those options, select the path for the R engine’s installation folder.
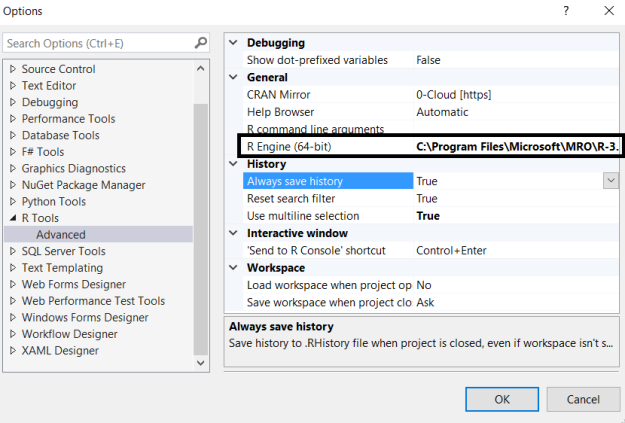
Figure 5: Options in R Tools.
Select this field and update the directory which it targets to target another directory for a different R engine. Once done, you can restart the Visual Studio to take the actions.
3. Plotting graphs
Another great feature of R programming is that it provides you with native support for graphical presentations. If you want to build charts, pie charts and bar charts or graphs. You can get the functions that can do the trick for you! In no time, you will be up and running your own projects, presentations and anything.
Benefit is that R generates quality and enterprise ready graphics, not just careless graphics! You can show the R plot window by either executing the command for plotting the graph or by manually opening it. To select the R plot, you can go to R Tools → Windows → R Plot. You can then direct R to build and generate the graphics on the plotter, a few of the commands used are:
- Pie
- Plot
- Barplot
You can use these commands to build the graphics, based on the data sets or vectors that you have. You can consult any of the statistical book or guide to learn more about charts and how they are used to render the data on the graphical level.
Just to demonstrate, I am going to use the following data, assuming they are marks:
> a <- c(55, 73, 44, 85, 65, 76)
Execute this, and R would create a variable in the environment.
Using plot()
First function to use is the plot() function. It plots the dotted graph of the points. Execute the following function,
> plot(a)
Following is the result of this command in the shell:
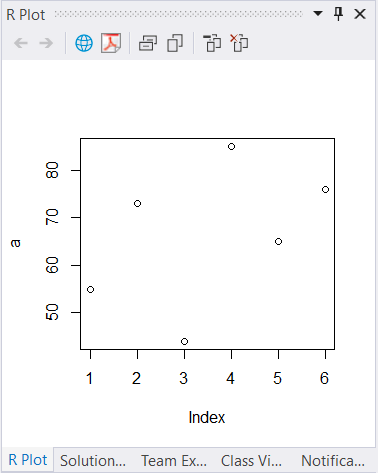
Figure 6: Plotting the dotted graph.
You can change how text is rendered and how the indices are selected, too!
Using barplot()
Next I would like to talk about the barplot() function that generates the graphics in the bar graph form. You pass the elements, and then it would generate the output in the bars form. The benefit is that you can compare how long a bar is, as compared to another one.
To get a bar graph, execute the following command:
> barplot(a)
The following output would be captured by you:

Figure 7: Bar graph for the data set.
This shows the data in a bar graph form. This is more readable and is easily understood. You can see how our graph is built and how the indices are selected for our data sets. You can then perform other actions, which I will talk about later before ending this section.
Using pie()
Pie is another kind of graphical notation in which we can render the data, to learn about it, read any basic statistical guide or course book. The pie uses the shape of a pie to render the graph. But, it uses the ratio of each data item to slice the pie into different sections to demonstrate their part in the pie.
To build a pie chart, use the following command:
> pie(a)
This would result in the following:

Figure 8: Pie chart graph.
Although this uses 1, 2, 3…6 to label. You can change them later in the function call. But I just want to tell you how Visual Studio can help you to have multiple windows working simultaneously for your project.
Features of R Plot
I mentioned that I will talk about the features of the R Plot. One of the best feature is that they are native. You do not need to import any extra package or library. But you can import other libraries, if you like any other implementation of the graphs.
Secondly, R Plot allows you to import the graphics in the form of:
- PNG images
- PDF documents
Which makes it even more easier to share the graphics that you render using the data set of your own environment.
Generating documents — R Markdown
Finally, I would like to talk about the R Markdown a bit. I think, this is one of the best things that R has right now. If you have ever been to Stack Overflow, GitHub or other similar websites, you would know that they already support a markdown that can be used to generate and render the HTML in a much simpler way. For example,
Hello _everyone_! I am using the following code

```
var obj = new Object();
```

// Would result in
<p>Hello <i>everyone</i>! I am using the following code</p>

<pre>
var obj = new Object();
</pre>
Which makes it much easier to render the documents in a much simpler way. Instead of writing a complex, standard or platform based language. You write a third-party standard, which is then converted to another standard. R Markdown does the same thing. You use it to generate the documents. The benefit is that you can use a single R markdown document to build multiple documents of multiple types and kinds:
- PDF documents
- HTML documents
- Word documents
- Other documents, supported!
Thus, it seriously elevates the document generation for the research that you have just conducted. Plus, it allows embedding the document code which can be executed when needed, such as generating the charts, calculating the means and so on and so forth.
In Visual Studio, you can create a new R Markdown document just the way you would create any other file in Visual Studio. Right click → Add → New Item → R Markdown.
This document can contain the plain-markdown content, which would be then rendered and compiled based on the medium that you want to render the data in.
References
To learn more about R Markdown, please refer to the following links:
Points of Interest
In this post I have talked about and walked you around many aspects of using R programming in Visual Studio IDE. Visual Studio is, no doubt, the best programming IDE available and providing the services for R programming is a great step by Microsoft.
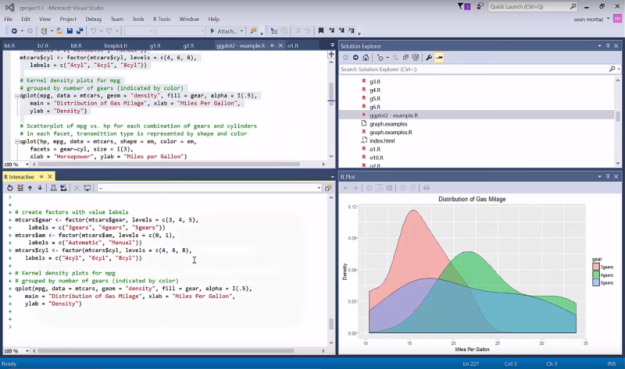
Figure 9: Visual Studio IDE having 4 windows of R tools open.
I assume, using Visual Studio for R programming is pretty much explained in this post, and in the later posts I will walk you through using R language for real projects and real time data processing and analysis.
In the later posts, I will talk about using R programming in real world projects. Hold tight, it’s going to be an excellent data science journey. 🙂